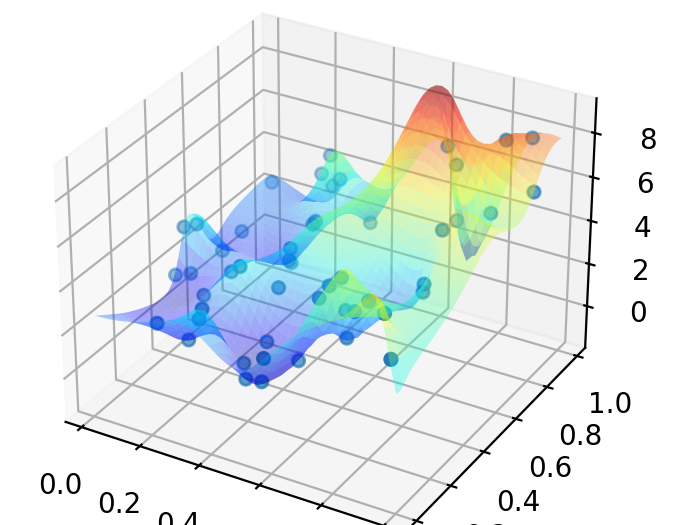
The quality of figure becomes important when it comes to publish document on Journal or conference presentation. One of the important factor is the resolution…
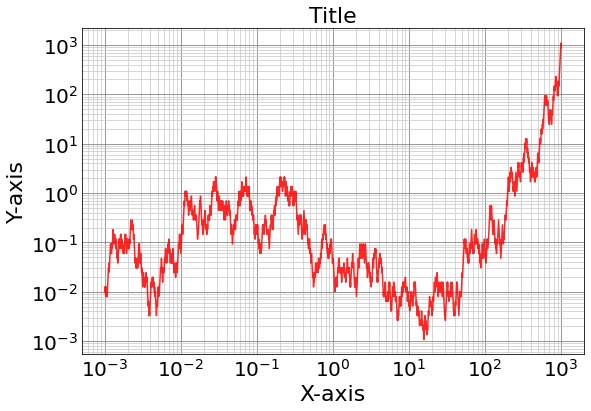
Many data tend to grow exponentially, e.g. population, stock price. When you want to analyze a data or phenomenon that you don’t know what it…
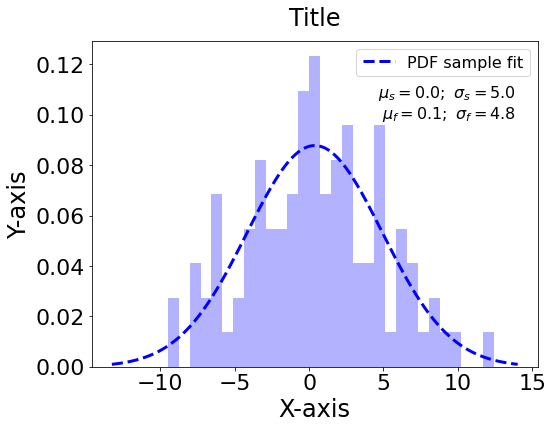
A histogram is a bar graph that shows the number of data belonging to each section as a height, with the width of the section…
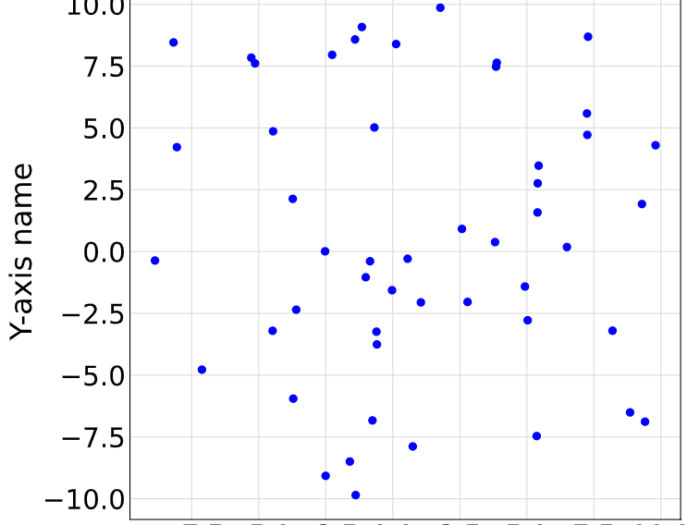
Creating scatter plot for scientific paper and presentation is always pain. Here, the template code was provided using pyplot module from the Matplotlib library. This…


