Calculating autocorrelation coefficients for time series stock data
The correlation coefficient between time series data and the data shifted by n steps is called the autocorrelation coefficient.
It is used to check if there is periodicity in the data or not.
You could simply estimate value by own function, or you can use the dedicated function defined in pandas to estimate them.
import numpy as np
import matplotlib.pyplot as plt
import yfinance as yf
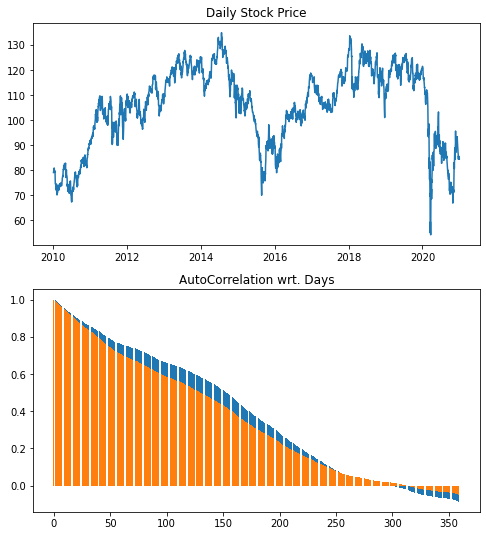
data = yf.download('CVX', '2010-1-1', '2021-1-1')['Close']
autocrr_series = [data.autocorr(lag=i) for i in range(360)]
fig = plt.figure(figsize=(8, 8))
ax = fig.add_subplot(211, title="Daily Stock Price")
ax.plot(data.index, data)
ax = fig.add_subplot(212, title="AutoCorrelation wrt. Days")
ax.bar(range(360), autocrr_series)
def autocov(X, N, k, Xs):
autoCov = 0
for i in np.arange(0, N-k):
autoCov += ((X[i+k])-Xs)*(X[i]-Xs)
return (1/(N-1))*autoCov
def autocorr_test(X,k):
N = np.size(X)
Xs = np.average(X)
return autocov(X, N, k, Xs) / autocov(X, N, 0, Xs)
auto_series_manu = [autocorr_test(data, k) for k in range(360)]
ax.bar(range(360), auto_series_manu)
plt.show()