Decision Tree Classification and Visualization using Python sklearn
Decision tree analysis can be explained as “divides the data step by step and outputs tree-like analysis results”
The beauty of Decision tree analysis is that it is easy easy to interpret the analysis from machine learning outcome, as regression model often tend to become black box type of outcome.
In decision tree analysis, you need to consider things such as how deep do you want to go in your analysis. If you do not stop the analysis at a reasonable depth, it tend to overfitting the data and the generalization performance will decrease.
Therefore, it is necessary to stop the analysis before it gets too deep.
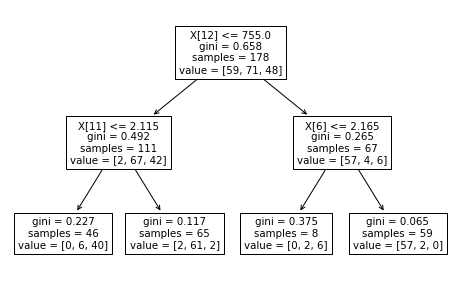
Goal here is to test sklearn and visualize tree structure using decision tree classifier using wine data set. Here visualization was done based on default function – tree.plot_tree(clf)
from sklearn.datasets import load_wine
from sklearn.tree import DecisionTreeClassifier
from matplotlib import pyplot as plt
from sklearn import tree


wine = load_wine()
X = wine.data
y = wine.target
clf = DecisionTreeClassifier(max_depth = 2)
clf.fit(X, y)

fig = plt.figure(figsize=(8,5))
tree.plot_tree(clf)