Estimate Buffet Indicator modified by US and world bank money supply
The Buffett Indicator is the is a well known measure of the stock market condition using GDP data.
To understand the basic logic behind the Buffett Index (Total Market Cap / GDP ), we need to understand the economic cycle. The premise is that the economy runs primarily on consumption, and individuals must produce in order to consume. Companies make profits by generating revenue from consumption, which is ultimately reflected in the stock market. Therefore, GDP, which reflects total production, is the fundamental driver of corporate profits and market capitalization.
Yet another factor that may affect market capitalization is the total assets of the Federal Reserve. Like any other financial statement, the Fed’s balance sheet is made up of assets and liabilities. The Federal Reserve report shows the consolidated state of all total assets, total liabilities, and total capital. the Fed’s assets are mainly government securities and loans that the Fed makes to its regional banks.
Fed’s balance sheet has been used to predict changes in the business cycle, and the expansion or contraction of the Fed’s balance sheet will certainly affect the economy and consumer and business spending, which in turn will affect the stock market. Generally speaking, the Fed, as part of its monetary policy, buys assets when it wants to increase the money supply and sells assets when it wants to decrease the money supply. if the Fed’s goal is expansionary, it puts more money into the market and lowers interest rates. if the Fed’s goal is expansionary, it puts more money into the market and lowers interest rates. In this case, people can borrow money at lower interest rates, so individuals will spend and companies will expand their business. On the other hand, when interest rates are significantly lower, the value of a dollar of future profits is higher, thus encouraging investment. These results in an inflow of funds into the stock market and an increase in market capitalization.
Therefore, the Buffet indicator can be modified using (Market Cap) with (GDP+FRB total assets) ratio as an indicator of market valuation that takes into account the Fed’s total assets. This indicator works in the same way as the Buffett indicator, but with an additional version.
Goal here is to write a python code to estimate basic Buffet Indicator –
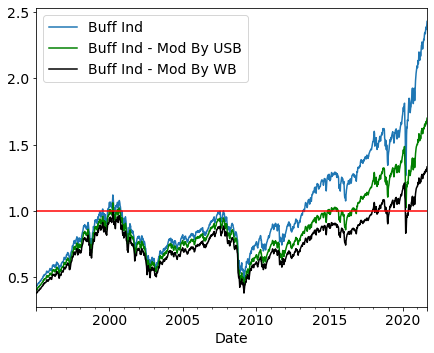
Buffet Ind = Wilshire 5000 / Inflation Adjusted GDP
Then, estimate modified buffet indicator using US Federal Bank Asset (USFA), and in addition, use 50% from world major money supply such as EU ECB and Japan, see if it has large impact to stock valuation if foreign money supply has contributed to the US economy and stock market
Buffet Ind Mod by USB = Wilshire 5000 / (Inf. A. GDP + USFA)
Buffet Ind Mod by WB = Wilshire 5000 / ( Inf. A. GDP + USFA + WB/2)
from fredapi import Fred
import pandas as pd
import matplotlib.pyplot as plt
fred = Fred(api_key='XXX')

start_date = '1995-1-1'


GDP    = pd.DataFrame(fred.get_series('GDPC1', observation_start=start_date)) # Seasonally adjusted real GDP # seasonally ajusted non-fram employment in thousands
WALCL  = pd.DataFrame(fred.get_series('WALCL', observation_start=start_date))  # only starts in 2010 at Fred for some reason
EURCL  = pd.DataFrame(fred.get_series('ECBASSETSW', observation_start=start_date))  # only starts in 2010 at Fred for some reason
JAPCL  = pd.DataFrame(fred.get_series('JPNASSETS', observation_start=start_date))  # only starts in 2010 at Fred for some reason
USMKT  = pd.DataFrame(fred.get_series('WILL5000PRFC', observation_start=start_date))  # only starts in 2010 at Fred for some reason


Sentiment_Weekly  = pd.DataFrame()
Sentiment_Weekly['GDP']    = GDP.reindex(USMKT.index, method='ffill').resample('W').mean().interpolate(limit=10000, limit_direction='both')
Sentiment_Weekly['WALCL']  = WALCL.reindex(USMKT.index, method='ffill').resample('W').mean().interpolate(limit=10000, limit_direction='both')
Sentiment_Weekly['EURCL']  = EURCL.reindex(USMKT.index, method='ffill').resample('W').mean().interpolate(limit=10000, limit_direction='both')
Sentiment_Weekly['JAPCL']  = JAPCL.reindex(USMKT.index, method='ffill').resample('W').mean().interpolate(limit=10000, limit_direction='both')
Sentiment_Weekly['USMKT']  = USMKT.reindex(USMKT.index, method='ffill').resample('W').mean().interpolate(limit=10000, limit_direction='both')


Sentiment_Weekly['Buff Ind']   = Sentiment_Weekly['USMKT'] /(Sentiment_Weekly['GDP'])
Sentiment_Weekly['Buff Ind - Mod By USB']   = Sentiment_Weekly['USMKT'] /(Sentiment_Weekly['GDP']  + Sentiment_Weekly['WALCL']/1000 )
Sentiment_Weekly['Buff Ind - Mod By WB']   = Sentiment_Weekly['USMKT'] /(Sentiment_Weekly['GDP']  + Sentiment_Weekly['WALCL']/1000 + Sentiment_Weekly['EURCL']/1000/2 + Sentiment_Weekly['JAPCL']/1000/2  )

plt.rcParams.update({'font.size': 14})
ax = Sentiment_Weekly['Buff Ind'].plot(figsize=(7, 5.5), legend=True)
Sentiment_Weekly['Buff Ind - Mod By USB'].plot(color ='g',ax=ax, legend=True)
Sentiment_Weekly['Buff Ind - Mod By WB'].plot(color ='k',ax=ax, legend=True)
plt.legend(loc='upper left')
plt.plot([1000,3000], [1, 1], 'r')
Results are shown in plot below.
It is clear that money supply from world can be a significant source to justify US stock market.