How to save matplotlib graphs in high resolution
The quality of figure becomes important when it comes to publish document on Journal or conference presentation. One of the important factor is the resolution of the image when you save the file.
Typically you can snagit or copy default set figures from plt.show() to and save it with arbitrary file type.
In order to get a high resolution output, you will need call a function matplotlib.pyplot.savefig
The image can then be saved to a higher resolution by giving a larger value to the dpi argument when saving.
import numpy as np
import matplotlib.cm as cm
import matplotlib.pyplot as plt
from mpl_toolkits.mplot3d import Axes3D
from scipy.interpolate import Rbf
#------------------------------------------
# Get 2D, Random sample data
numdata = 50
np.random.seed(65537)
x = np.random.random(numdata)
y = np.random.random(numdata)
xy = np.ones((numdata,2))
xy[:,0] = x/np.max(x)
xy[:,1] = y/np.max(y)
z = x**2 + y**2 + 3*x**3 + y + np.random.random(numdata)*4 # Noise
#------------------------------------------
# 2D data fitting with RBF function
mesh = 50
xx, yy = np.meshgrid(np.linspace(x.min(), x.max(), mesh), np.linspace(y.min(), y.max(), mesh))
rbf = Rbf(x, y, z, function = 'multiquadric',smooth = 0.01, epsilon = 0.05)
zz = rbf(xx, yy)
fig = plt.figure()
ax = fig.add_subplot(111, projection='3d')
ax.scatter(x, y, z)
ax.plot_surface(xx, yy, zz, rstride=1, cstride=1, alpha=0.35 , cmap=cm.jet)
plt.title("Radial Basis Function");
ax.set_zlim3d(-z.min()-1, z.max()+1)
#------------------------------------------
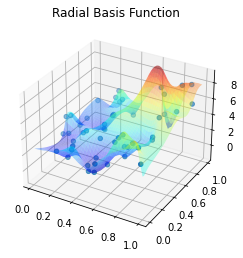
# Low Resolution
plt.show()
#------------------------------------------
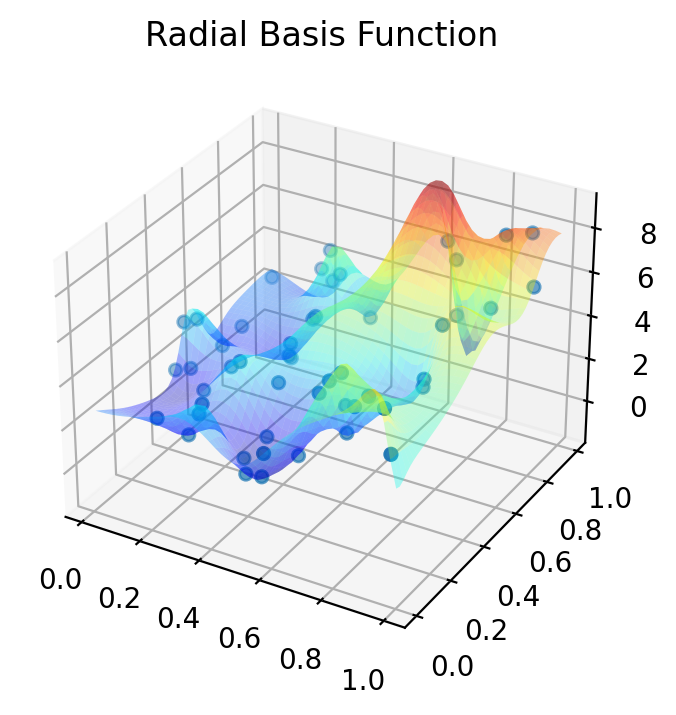
# High Resolution
fig.savefig('HighResolution.png',dpi = 200, bbox_inches='tight')
fig.savefig('dmy.png',dpi = 10)
import numpy as np
import matplotlib.cm as cm
import matplotlib.pyplot as plt
from mpl_toolkits.mplot3d import Axes3D
from scipy.interpolate import Rbf
#------------------------------------------
# Get 2D, Random sample data
numdata = 50
np.random.seed(65537)
x = np.random.random(numdata)
y = np.random.random(numdata)
xy = np.ones((numdata,2))
xy[:,0] = x/np.max(x)
xy[:,1] = y/np.max(y)
z = x**2 + y**2 + 3*x**3 + y + np.random.random(numdata)*4 # Noise
#------------------------------------------
# 2D data fitting with RBF function
mesh = 50
xx, yy = np.meshgrid(np.linspace(x.min(), x.max(), mesh), np.linspace(y.min(), y.max(), mesh))
rbf = Rbf(x, y, z, function = 'multiquadric',smooth = 0.01, epsilon = 0.05)
zz = rbf(xx, yy)
fig = plt.figure()
ax = fig.add_subplot(111, projection='3d')
ax.scatter(x, y, z)
ax.plot_surface(xx, yy, zz, rstride=1, cstride=1, alpha=0.35 , cmap=cm.jet)
plt.title("Radial Basis Function");
ax.set_zlim3d(-z.min()-1, z.max()+1)
#------------------------------------------
# Low Resolution
plt.show()
#------------------------------------------
# High Resolution
fig.savefig('HighResolution.png',dpi = 200, bbox_inches='tight')
fig.savefig('dmy.png',dpi = 10)