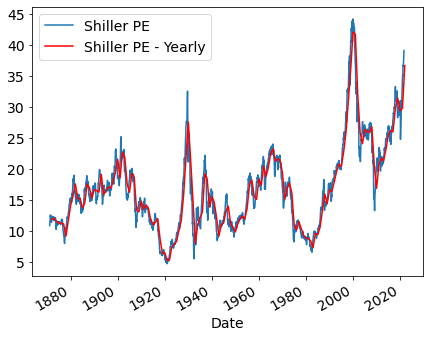
Scrape SP500 Shiller PE ratio, then estimate yearly average
Shiller PE ratio is cumbersome to estimate especially for stock group data e.g. S&P 500. It is convenient to scrape from website where historical and latest data are available, e.g. https://www.multpl.com/
Goal here is to scrape data from website, and manipulate data as you need such as yearly average from monthly data.
import matplotlib.pyplot as plt
from bs4 import BeautifulSoup
import pandas as pd
import requests


url="https://www.multpl.com/shiller-pe/table/by-month"
html_content = requests.get(url).text
soup = BeautifulSoup(html_content, "lxml")
table = str(soup.find_all('table')[0])
SP500_SPE = pd.read_html(table)[0]
SP500_SPE.columns = ['Date', 'Shiller PE']
SP500_SPE.set_index('Date', inplace=True)
SP500_SPE.index = pd.to_datetime(SP500_SPE.index)
SP500_SPE['Shiller PE'] = SP500_SPE['Shiller PE'].astype(float)

# Yearly frequency data
SP500_SPE_Yearly  = SP500_SPE.resample('Y').mean()
SP500_SPE_Yearly.columns = ['Shiller PE - Yearly']

plt.rcParams.update({'font.size': 14})
ax = SP500_SPE.plot(figsize=(7, 5))
SP500_SPE_Yearly.plot(color ='r',ax=ax)