Sentiment Analysis of Stock headline news using Python NLTK library
The use of numerical values such as stock prices, trading volume, economic indicators, and financial data is fundamental to analyzing markets, and machine learning systems are no exception. However, another important approach is to use natural language processing and other methods to handle text data to see its relevance to financial markets.
The goal of this note is to understand sentiment analysis in practical situation, but not intend to use them to predict high return stocks etc. This is because just use of simple natural language processing will not work for that purpose, because humans tend to create baseline based on their own self-determined scales.
We tend to create baseline numbers such as “the Dow Jones Industrial Average has exceeded $27,000” or “the dollar is on the verge of 100 yen”. This is because it is easy for human beings to understand, but there is no inevitability in the neatness of the numbers when financial markets are viewed as a physical phenomenon.
However, it can be used to measure how the sentiment to the stock or cryptocurrency changes by time, such as sentiment to the bitcoin.
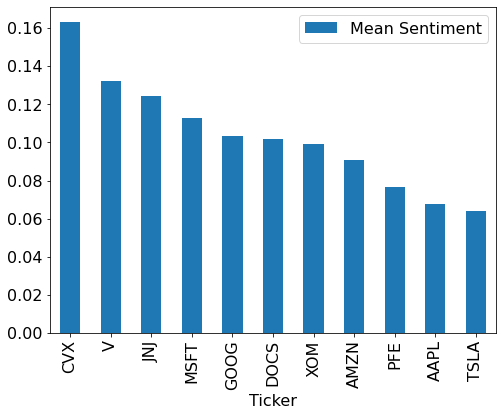
Below code perform sentiment analysis from python nltk package to the recent headline news of given ticker symbol, and estimate average of sentiment. The code available here for basic usage of nltk package.
#%%

import pandas as pd
from bs4 import BeautifulSoup
import matplotlib.pyplot as plt
from urllib.request import urlopen, Request
import nltk
from nltk.sentiment.vader import SentimentIntensityAnalyzer


# Parameters
tickers = ['CVX', 'XOM', 'TSLA', 'AMZN', 'GOOG', 'MSFT', 'AAPL', 'DOCS', 'JNJ', 'V', 'PFE']
nltk.download('vader_lexicon')

# Get Data
finwiz_url = 'https://finviz.com/quote.ashx?t='
news_tables = {}

for ticker in tickers:
    url = finwiz_url + ticker
    req = Request(url=url,headers={'user-agent': 'my-app/0.0.1'})
    resp = urlopen(req)
    html = BeautifulSoup(resp, features="lxml")
    news_table = html.find(id='news-table')
    news_tables[ticker] = news_table


# Iterate through the news
parsed_news = []
for file_name, news_table in news_tables.items():
    for x in news_table.findAll('tr'):
        text = x.a.get_text()
        date_scrape = x.td.text.split()

        if len(date_scrape) == 1:
            time = date_scrape[0]

        else:
            date = date_scrape[0]
            time = date_scrape[1]

        ticker = file_name.split('_')[0]

        parsed_news.append([ticker, date, time, text])

# Sentiment Analysis
analyzer = SentimentIntensityAnalyzer()

columns = ['Ticker', 'Date', 'Time', 'Headline']
news = pd.DataFrame(parsed_news, columns=columns)
scores = news['Headline'].apply(analyzer.polarity_scores).tolist()

df_scores = pd.DataFrame(scores)
news = news.join(df_scores, rsuffix='_right')


# View Data
news['Date'] = pd.to_datetime(news.Date).dt.date

unique_ticker = news['Ticker'].unique().tolist()
news_dict = {name: news.loc[news['Ticker'] == name] for name in unique_ticker}

values = []
for ticker in tickers:
    df_sentiment = news_dict[ticker]
    df_sentiment = df_sentiment.set_index('Ticker')

    mean = round(df_sentiment['compound'].mean(), 4)
    values.append(mean)

df = pd.DataFrame(list(zip(tickers, values)), columns =['Ticker', 'Mean Sentiment'])
df = df.set_index('Ticker')
df = df.sort_values('Mean Sentiment', ascending=False)

plt.rcParams.update({'font.size': 16})
df.plot.bar(figsize=(8,6))
# %%
a
