Time series data fitting with Python polynomial regression – polyfit
Goal here is to to understand basic polynomial regression from python numpy function – poly1d.
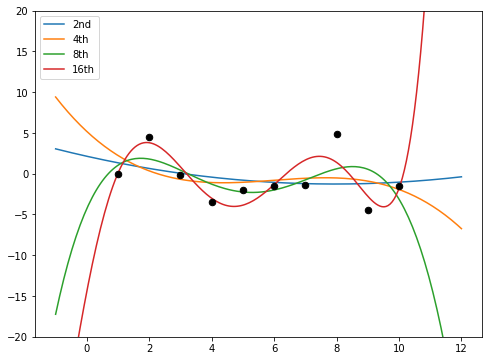
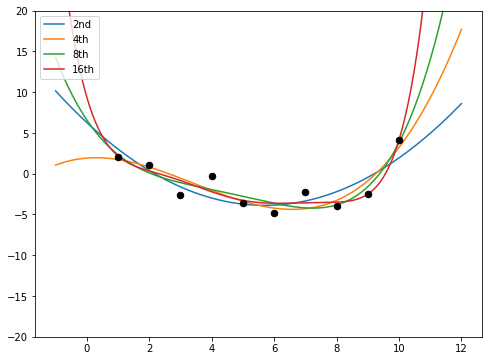
The code below does fitting of random 1D data points by 2-3-4-6th order of polynomial function to see the impact.
import numpy as np
import matplotlib.pyplot as plt

#------------------------------------------
# Get polynomial Coefficient : 1D, Random
numdata = 10
x = np.linspace(1, numdata, numdata)
y = np.random.random(numdata)*10 - 5.0

# How much degree ?
p3  = np.poly1d(np.polyfit(x, y, 2))
p6  = np.poly1d(np.polyfit(x, y, 3))
p10 = np.poly1d(np.polyfit(x, y, 4))
p30 = np.poly1d(np.polyfit(x, y, 6))

# Shou picture
fig = plt.figure(figsize=(8, 6))
xp = np.linspace(-1, numdata+2, 200)

plt.plot(xp, p3(xp), '-', label="2nd")
plt.plot(xp, p6(xp), '-', label="3th")
plt.plot(xp, p10(xp), '-', label="4th")
plt.plot(xp, p30(xp), '-', label="6th")
plt.plot(x, y, '.k',  markersize=13,linewidth = 2)
plt.legend(loc="upper left")

plt.ylim(-20,20)
Test run 1 – fitting shows consistent curve when the data has weak trend
Test run 2 – interpolations are not consistent with noisy data